For Physiological Psychology, I asked my students to complete surveys at the beginning and end of the semester regarding their use of and attitudes toward social and digital media use in higher education.
I obtained IRB approval for this research from SNC’s IRB. Completing these surveys was completely optional for the students. These data are from 12 students at the end of the semester and 13 students at the beginning of the semester who completed the surveys. There were 20 students total who participated in the digital/social media component of the course. My guess is that there is some, but not complete, overlap in who completed the surveys at the beginning and end of the semester.
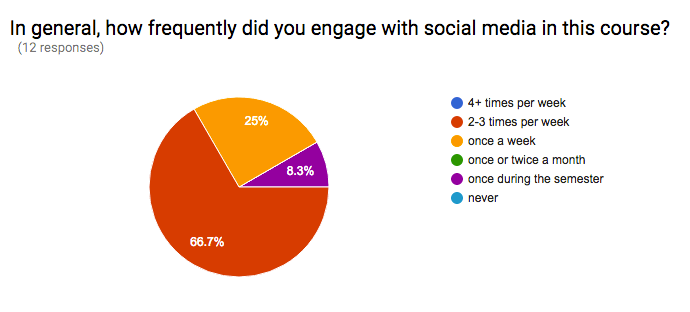
The x-axis on the following figures ranges from 1 (strongly disagree) to 7 (strongly agree). The Y-Axis is frequency. You can click on the figures to make them larger and scroll through.


These visualizations are from our Live Twitter Chat with Loras College students:


I also storified some of our live twitter chat. Here are some examples:
